Posted on 02 August by Stephan Stein in BCG Matrix
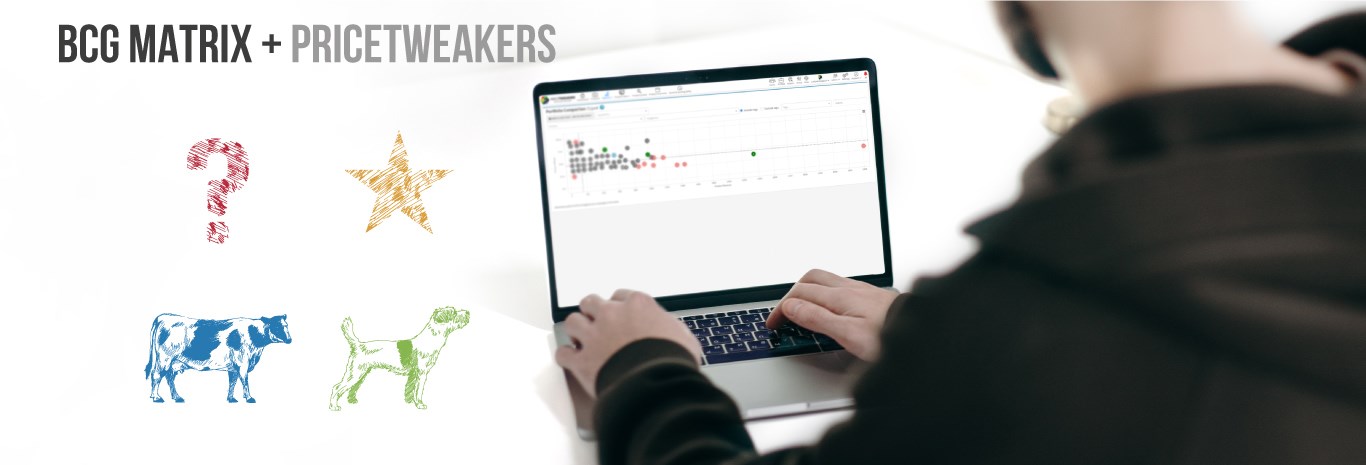
This week we added two new advanced tools to the reports section. They are called The Product Performance Report and the Product Performance Chart. Both are based on the BCG Matrix, which is a way of looking at your product portfolio. I have called it something else because we also want to use this method to steer a little more towards the performance of your products and your product groups. Why is it important to do this? By mapping out your best-selling products, you can create a better Dynamic Pricing strategy. By looking at your products with the most margin but with a lower turnover/market share, you can ensure that you aim for more turnover/market share. That way, you can earn more net money from these products in the long run.
PriceTweakers will ensure that later this year, you can also manage this via Dynamic Pricing (DRS). Both tools are part of the (DRS) Dynamic Pricing module and only work by placing a script developed by us, which you can place on your website within a few minutes via Google Tag Manager.
Here's a short explanation:
Question Marks (market share is low, high market growth)
Most products start as Question Marks, which are typically in a fast-growing market but have a low market share. The name Question mark speaks for itself; am I putting money and energy into this product to gain market share in this growing market? Yes or no?
Question Marks should change to Stars in the short term. For example, you need to generate more sales by temporarily reducing sales or investing more advertising budget on the products that fall into this group.
Stars (very high market share and strong growth)
Stars are the products for your webshops or brand. These products are, say, 20% of the 80/20 rule. It means that you have to keep investing in, for example, Google ADS and have to make a separate strategy in, for example, Dynamic Pricing (DRS) to ensure that you remain the market leader with these products. Stars can generate a lot of revenue for a long time. And that is very important for your company and business.
Cash Cows (high market share, low market growth)
Once the market enters a mature phase of the Product Life Cycle, a Star will turn into a Cash Cow. A product that still enjoys a high market share but in a market that is still growing slowly or even stagnating. These products still generate a lot of turnovers, which can be used to make new investments.
Dogs (low market share, low market growth)
It is not always advisable to repel these Dogs. You should try to improve the position because a Dog can generate quite a bit of cash flow, and that is important for the company. So, I recommend trying to push your products from the Dog category to the Cash Cows category. You can do this by using the right strategy. Take a good look at your competitors and how they rank in the market.
Share this page