

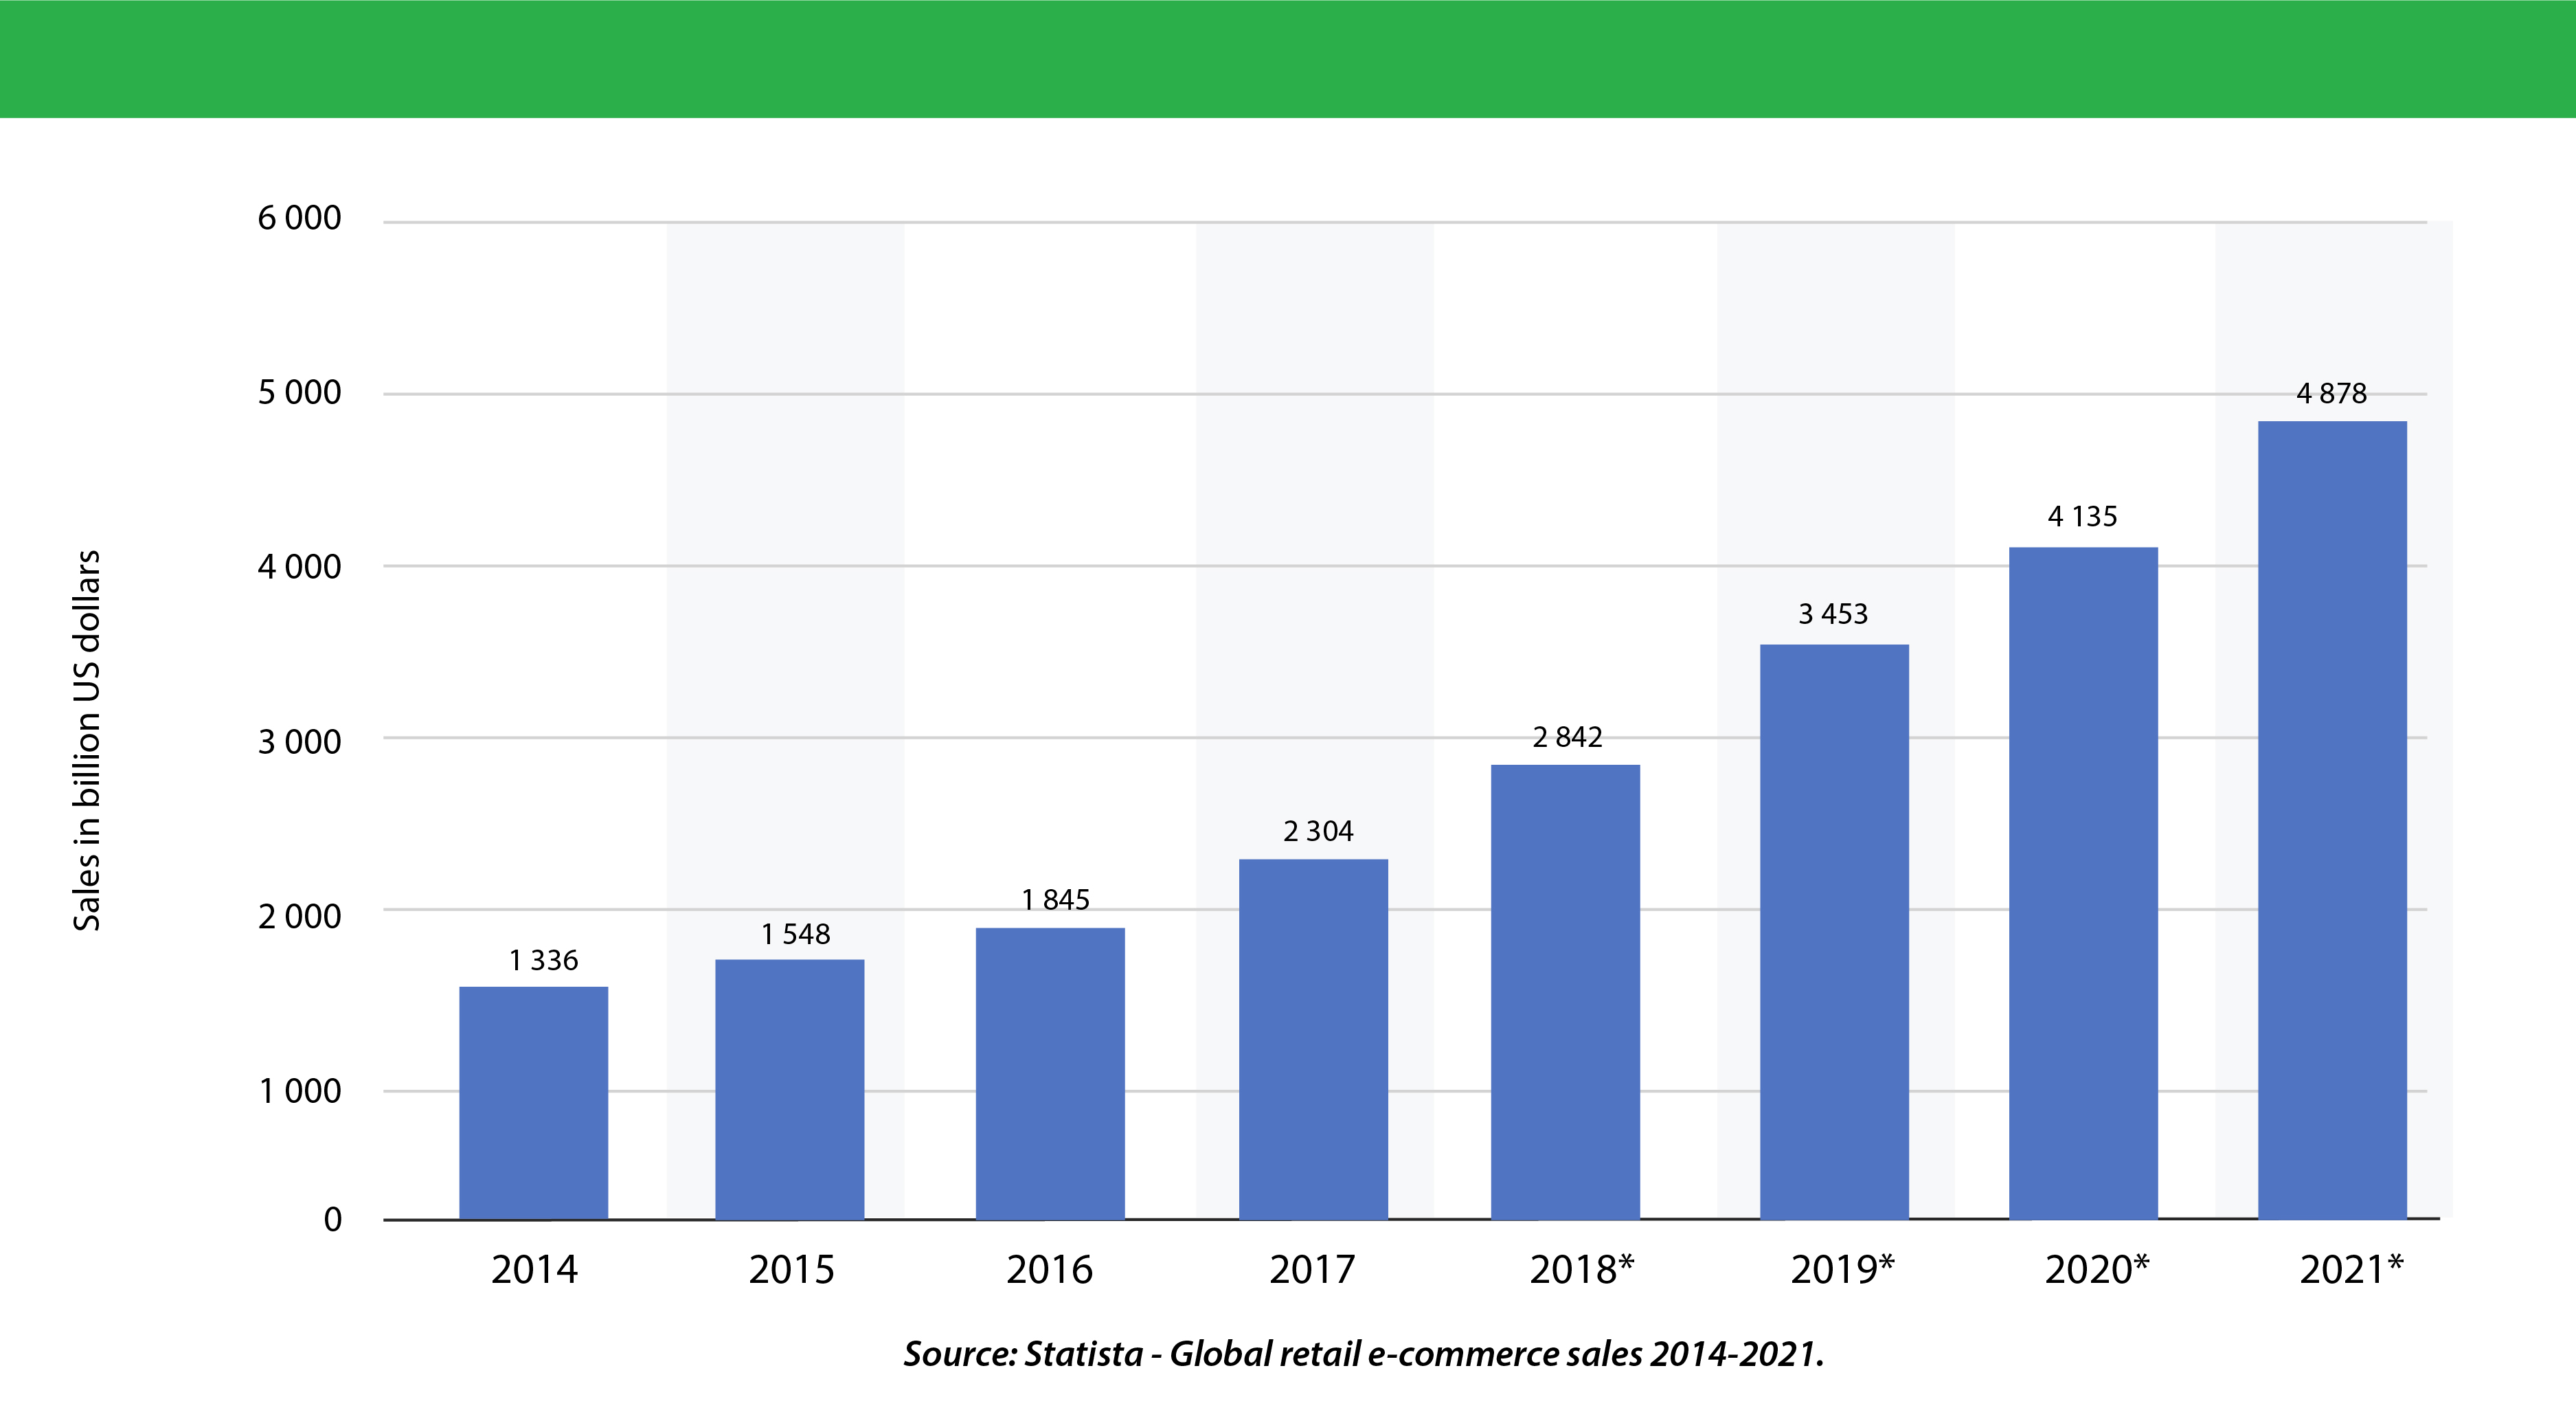
Global E-commerce Sales
E-commerce sales have climbed for years with continuous further growth expected. In 2017, retail E-commerce sales worldwide amounted to 2.3 trillion US dollars, and e-retail revenues are projected to grow to 4.88 trillion US dollars in 2021.
Global Number of Digital Buyers
Current E-commerce statistics state that 40 percent of worldwide internet users have bought products or goods online via desktop, mobile, tablet, or other online devices. This amounts to more than 1 billion online buyers and is projected to continuously grow.

Number of Digital Buyers Worldwide from 2014 to 2021 (In Billions)

Global Digital Retailers for Cross-Border Purchases
An incredible range of different E-commerce stores has expanded as online shoppers are increasingly looking outside their country’s borders for purchases. Cross-border E-commerce is a growing phenomenon, and these digital retailers are leading cross-border purchases.

Online Purchasing – Top 3 Product Categories by Region
Some categories have higher online purchasing penetration and frequency of purchasing than others. The ability to search and compare product and service specifications, product availability and prices, as well as cross-border purchases, has contributed to the success of these categories.

Digital Payments
Digital payments are closely connected to E-commerce. Alternative payment methods such as digital wallets or online payment providers have seen increased adoption rates and rapid growth in the past few years. These methods are the most used around the world.

Sources
Statista. Global retail e-commerce sales 2014-2021. [Web Page]. March 2018. https://www.statista.com/statistics/379046/worldwide-retail-e-commerce-sales
Statista. Digital buyer penetration worldwide 2016 to 2021. [Web Page]. July 2017. https://www.statista.com/statistics/261676/digital-buyer-penetration-worldwide
Statista. Global number of digital buyers 2014-2021. [Web Page]. July 2017. https://www.statista.com/statistics/251666/number-of-digital-buyers-worldwide
Statista. Preferred global digital retailers for cross-border purchases, 2018. [Web Page]. January 2019. https://www.statista.com/statistics/878623/digital-retailers-digital-buyers-cross-border-digital-purchases
E-Commerce: Statistics and Market Data about E-commerce. [Web Page]. https://www.statista.com/markets/413/e-commerce
Key Figures of E-Commerce: Statistics and Market Data on Key Figures of E-Commerce. [Web Page]. https://www.statista.com/markets/413/topic/544/key-figures-of-e-commerce
Nielsen Connected Commerce. [PDF Report]. November 2018. https://www.nielsen.com/content/dam/nielsenglobal/de/docs/connected-commerce-report.pdf
Nielsen Global Connected Commerce Report. [PDF Report]. January 2016. https://www.nielsen.com/content/dam/nielsenglobal/jp/docs/report/2016/Nielsen-Global-Connected-Commerce-Report-January-2016